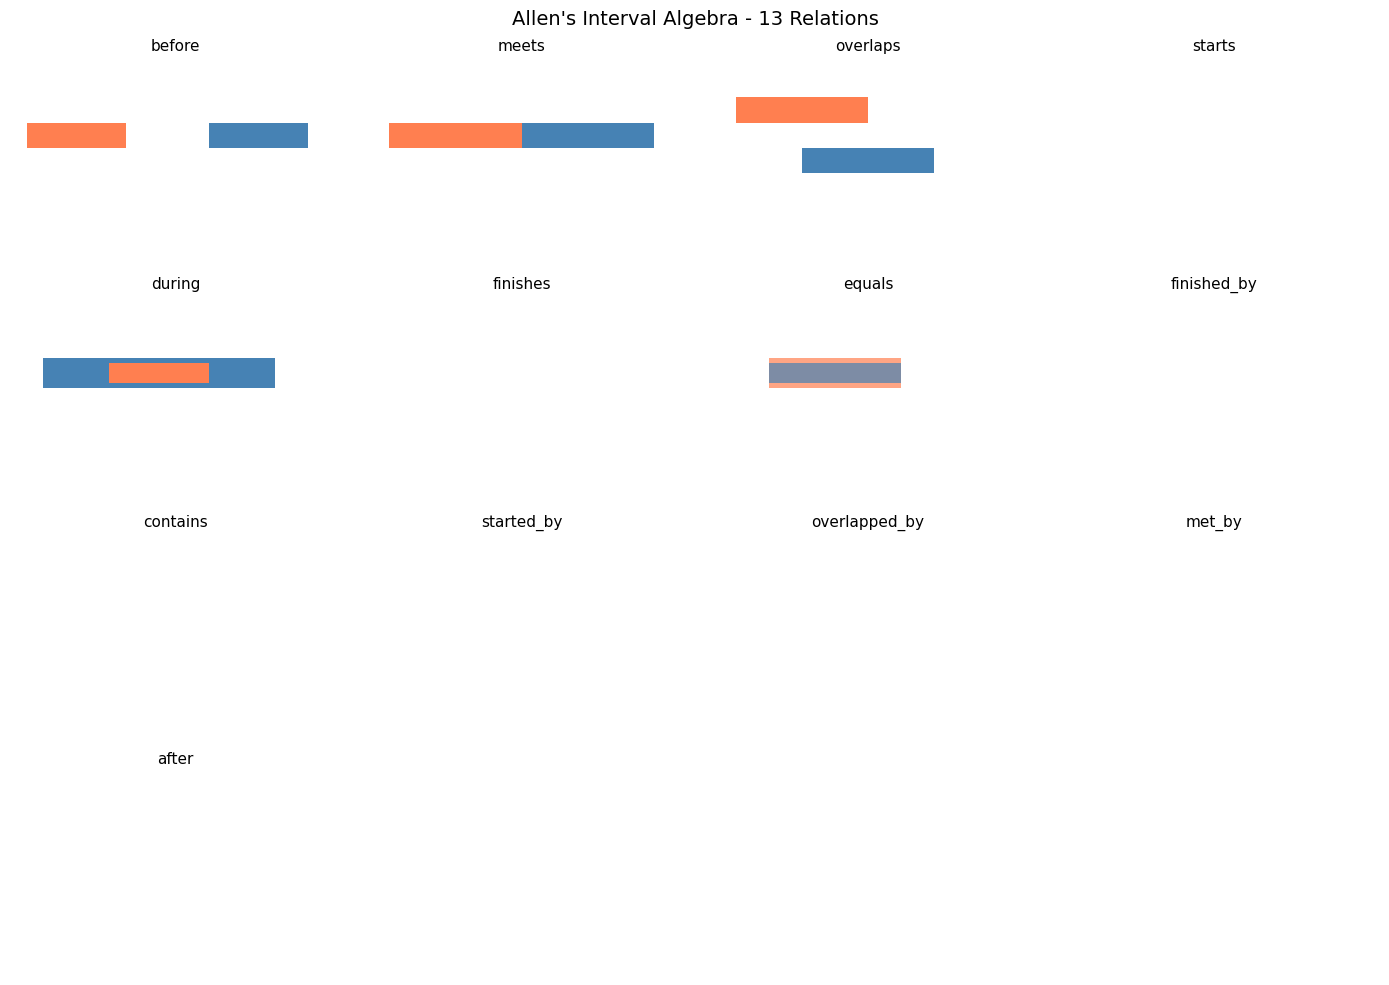
# Visualisation des relations d'Allen
def plot_allen_relations():
    fig, axes = plt.subplots(4, 4, figsize=(14, 10))
    axes = axes.flatten()

    relations = [
        ('before', 'AAAAAAA                 BBBBBBB'),
        ('meets', 'AAAAAAA|BBBBBBB'),
        ('overlaps', 'AAAAAAA\n     BBBBBBB'),
        ('starts', 'AAAAAAA\nBBBBBBBBBBBBB'),
        ('during', '   AAAAAAA\nBBBBBBBBBBBBB'),
        ('finishes', '      AAAAAAA\nBBBBBBBBBBBBB'),
        ('equals', 'AAAAAAA\nBBBBBBB'),
        ('finished_by', 'BBBBBBBBBBBBB\n      AAAAAAA'),
        ('contains', 'BBBBBBBBBBBBB\n   AAAAAAA'),
        ('started_by', 'BBBBBBBBBBBBB\nAAAAAAA'),
        ('overlapped_by', '     BBBBBBB\nAAAAAAA'),
        ('met_by', 'BBBBBBB|AAAAAAA'),
        ('after', 'BBBBBBB                 AAAAAAA'),
    ]

    for i, (name, diagram) in enumerate(relations):
        ax = axes[i]
        ax.set_xlim(0, 10)
        ax.set_ylim(0, 4)
        ax.axis('off')
        ax.set_title(name, fontsize=11)

        # Dessiner les intervalles
        if name == 'before':
            ax.barh(2.5, 3, left=0.5, height=0.5, color='coral', label='A')
            ax.barh(2.5, 3, left=6, height=0.5, color='steelblue', label='B')
        elif name == 'meets':
            ax.barh(2.5, 4, left=1, height=0.5, color='coral')
            ax.barh(2.5, 4, left=5, height=0.5, color='steelblue')
        elif name == 'overlaps':
            ax.barh(3, 4, left=1, height=0.5, color='coral')
            ax.barh(2, 4, left=3, height=0.5, color='steelblue')
        elif name == 'during':
            ax.barh(2.5, 7, left=1, height=0.6, color='steelblue')
            ax.barh(2.5, 3, left=3, height=0.4, color='coral')
        elif name == 'equals':
            ax.barh(2.5, 4, left=2, height=0.6, color='coral', alpha=0.7)
            ax.barh(2.5, 4, left=2, height=0.4, color='steelblue', alpha=0.7)
        # ... autres cas

    # Masquer les axes vides
    for i in range(len(relations), 16):
        axes[i].axis('off')

    plt.suptitle("Allen's Interval Algebra - 13 Relations", fontsize=14)
    plt.tight_layout()
    plt.show()

plot_allen_relations()