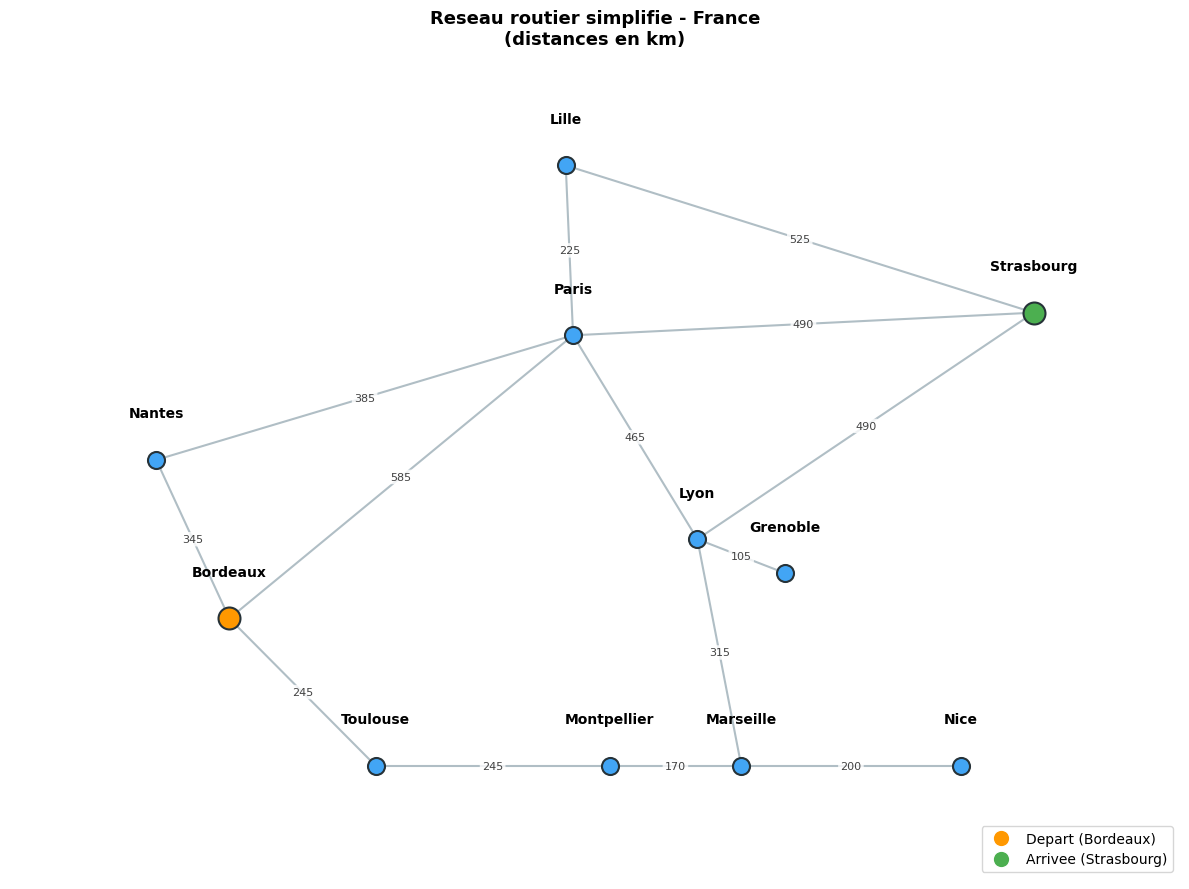
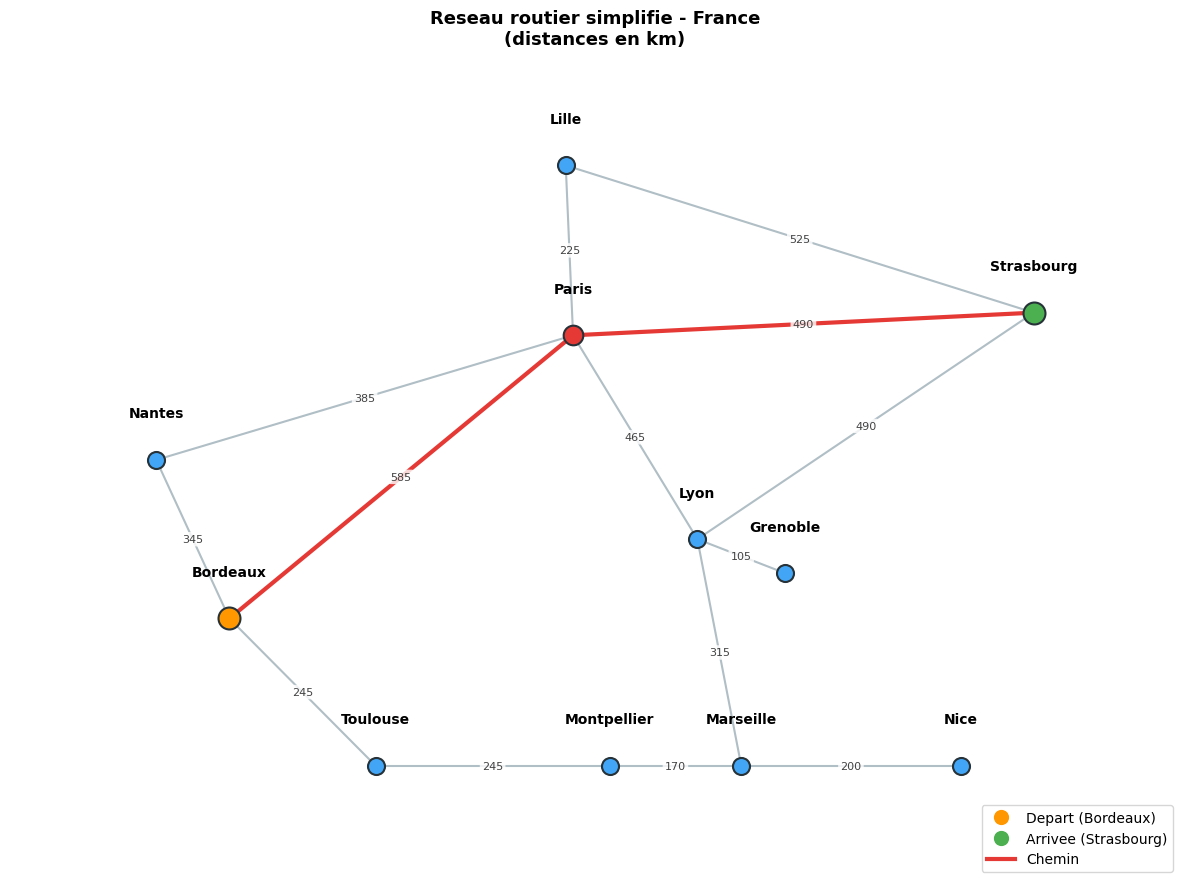
def visualize_route_graph(graph: dict, start: str = None, goal: str = None,
                          path: List[str] = None):
    """Visualise le graphe routier avec positions geographiques approximatives."""

    # Positions approximatives (longitude, latitude normalisees)
    city_positions = {
        'Paris':       (2.35, 6.3),
        'Lyon':        (3.2, 4.5),
        'Marseille':   (3.5, 2.5),
        'Lille':       (2.3, 7.8),
        'Strasbourg':  (5.5, 6.5),
        'Bordeaux':    (0.0, 3.8),
        'Toulouse':    (1.0, 2.5),
        'Montpellier': (2.6, 2.5),
        'Nantes':      (-0.5, 5.2),
        'Nice':        (5.0, 2.5),
        'Grenoble':    (3.8, 4.2),
    }

    fig, ax = plt.subplots(figsize=(12, 9))

    # Dessiner les aretes
    drawn_edges = set()
    for city, neighbors in graph.items():
        for neighbor, dist in neighbors:
            edge_key = tuple(sorted([city, neighbor]))
            if edge_key not in drawn_edges:
                drawn_edges.add(edge_key)
                x1, y1 = city_positions[city]
                x2, y2 = city_positions[neighbor]

                # Couleur speciale si dans le chemin
                is_path_edge = False
                if path:
                    for i in range(len(path) - 1):
                        if edge_key == tuple(sorted([path[i], path[i+1]])):
                            is_path_edge = True
                            break

                color = '#E53935' if is_path_edge else '#B0BEC5'
                lw = 3 if is_path_edge else 1.5

                ax.plot([x1, x2], [y1, y2], '-', color=color, linewidth=lw, zorder=1)

                # Distance au milieu de l'arete
                mx, my = (x1 + x2) / 2, (y1 + y2) / 2
                ax.text(mx, my, f"{dist}", ha='center', va='center',
                        fontsize=8, color='#424242',
                        bbox=dict(boxstyle='round,pad=0.2', facecolor='white',
                                  edgecolor='none', alpha=0.8))

    # Dessiner les villes
    for city, (x, y) in city_positions.items():
        if city == start:
            color = '#FF9800'
            size = 250
        elif city == goal:
            color = '#4CAF50'
            size = 250
        elif path and city in path:
            color = '#E53935'
            size = 200
        else:
            color = '#42A5F5'
            size = 150

        ax.scatter(x, y, s=size, c=color, edgecolors='#263238', linewidth=1.5, zorder=3)
        ax.text(x, y + 0.35, city, ha='center', va='bottom',
                fontsize=10, fontweight='bold')

    # Legende
    legend_elements = [
        plt.Line2D([0], [0], marker='o', color='w', markerfacecolor='#FF9800',
                   markersize=12, label=f'Depart ({start})' if start else 'Depart'),
        plt.Line2D([0], [0], marker='o', color='w', markerfacecolor='#4CAF50',
                   markersize=12, label=f'Arrivee ({goal})' if goal else 'Arrivee'),
    ]
    if path:
        legend_elements.append(
            plt.Line2D([0], [0], color='#E53935', linewidth=3, label='Chemin')
        )
    ax.legend(handles=legend_elements, loc='lower right', fontsize=10)

    ax.set_xlim(-1.5, 6.5)
    ax.set_ylim(1.5, 8.8)
    ax.set_title("Reseau routier simplifie - France\n(distances en km)",
                 fontsize=13, fontweight='bold')
    ax.axis('off')
    plt.tight_layout()
    plt.show()


# Afficher la carte
visualize_route_graph(france_graph, start='Bordeaux', goal='Strasbourg')