# Visualisation des features fondamentales
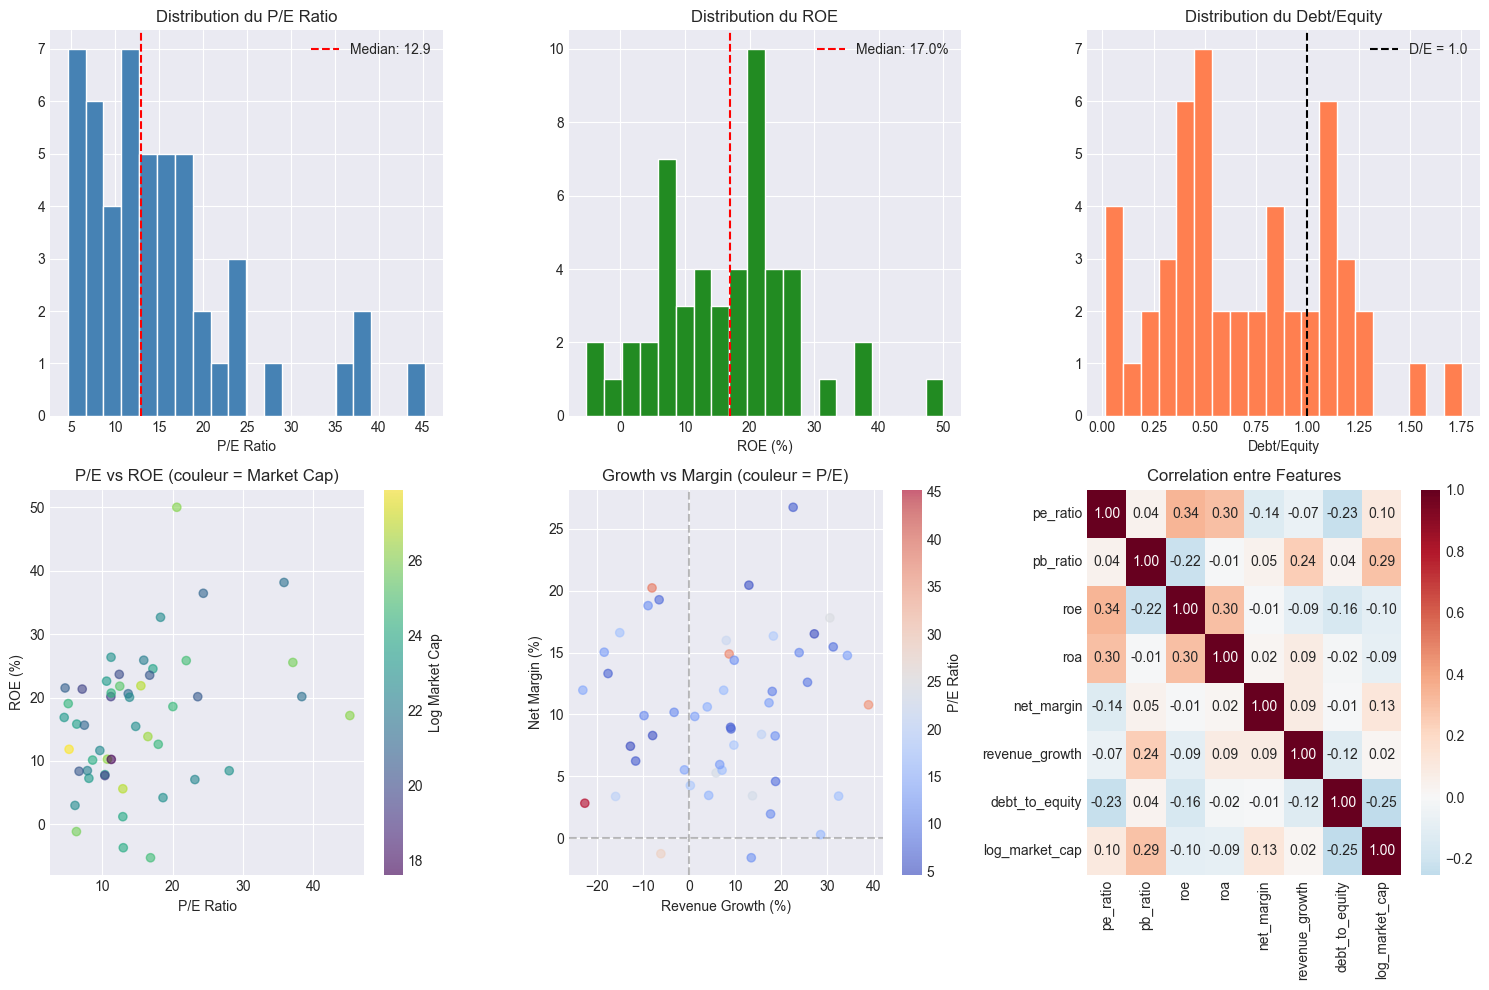
fig, axes = plt.subplots(2, 3, figsize=(15, 10))

# P/E Ratio distribution
axes[0, 0].hist(df_fundamentals['pe_ratio'], bins=20, color='steelblue', edgecolor='white')
axes[0, 0].axvline(df_fundamentals['pe_ratio'].median(), color='red', linestyle='--', label=f"Median: {df_fundamentals['pe_ratio'].median():.1f}")
axes[0, 0].set_xlabel('P/E Ratio')
axes[0, 0].set_title('Distribution du P/E Ratio')
axes[0, 0].legend()

# ROE distribution
axes[0, 1].hist(df_fundamentals['roe'] * 100, bins=20, color='forestgreen', edgecolor='white')
axes[0, 1].axvline(df_fundamentals['roe'].median() * 100, color='red', linestyle='--', label=f"Median: {df_fundamentals['roe'].median()*100:.1f}%")
axes[0, 1].set_xlabel('ROE (%)')
axes[0, 1].set_title('Distribution du ROE')
axes[0, 1].legend()

# Debt to Equity
axes[0, 2].hist(df_fundamentals['debt_to_equity'], bins=20, color='coral', edgecolor='white')
axes[0, 2].axvline(1.0, color='black', linestyle='--', label='D/E = 1.0')
axes[0, 2].set_xlabel('Debt/Equity')
axes[0, 2].set_title('Distribution du Debt/Equity')
axes[0, 2].legend()

# Scatter P/E vs ROE (Value vs Quality)
scatter = axes[1, 0].scatter(df_fundamentals['pe_ratio'], df_fundamentals['roe'] * 100,
                              c=df_fundamentals['log_market_cap'], cmap='viridis', alpha=0.6)
axes[1, 0].set_xlabel('P/E Ratio')
axes[1, 0].set_ylabel('ROE (%)')
axes[1, 0].set_title('P/E vs ROE (couleur = Market Cap)')
plt.colorbar(scatter, ax=axes[1, 0], label='Log Market Cap')

# Growth vs Margin
scatter2 = axes[1, 1].scatter(df_fundamentals['revenue_growth'] * 100, df_fundamentals['net_margin'] * 100,
                               c=df_fundamentals['pe_ratio'], cmap='coolwarm', alpha=0.6)
axes[1, 1].set_xlabel('Revenue Growth (%)')
axes[1, 1].set_ylabel('Net Margin (%)')
axes[1, 1].set_title('Growth vs Margin (couleur = P/E)')
axes[1, 1].axvline(0, color='gray', linestyle='--', alpha=0.5)
axes[1, 1].axhline(0, color='gray', linestyle='--', alpha=0.5)
plt.colorbar(scatter2, ax=axes[1, 1], label='P/E Ratio')

# Correlation heatmap
fundamental_cols = ['pe_ratio', 'pb_ratio', 'roe', 'roa', 'net_margin',
                    'revenue_growth', 'debt_to_equity', 'log_market_cap']
corr = df_fundamentals[fundamental_cols].corr()
sns.heatmap(corr, annot=True, fmt='.2f', cmap='RdBu_r', center=0, ax=axes[1, 2])
axes[1, 2].set_title('Correlation entre Features')

plt.tight_layout()
plt.show()