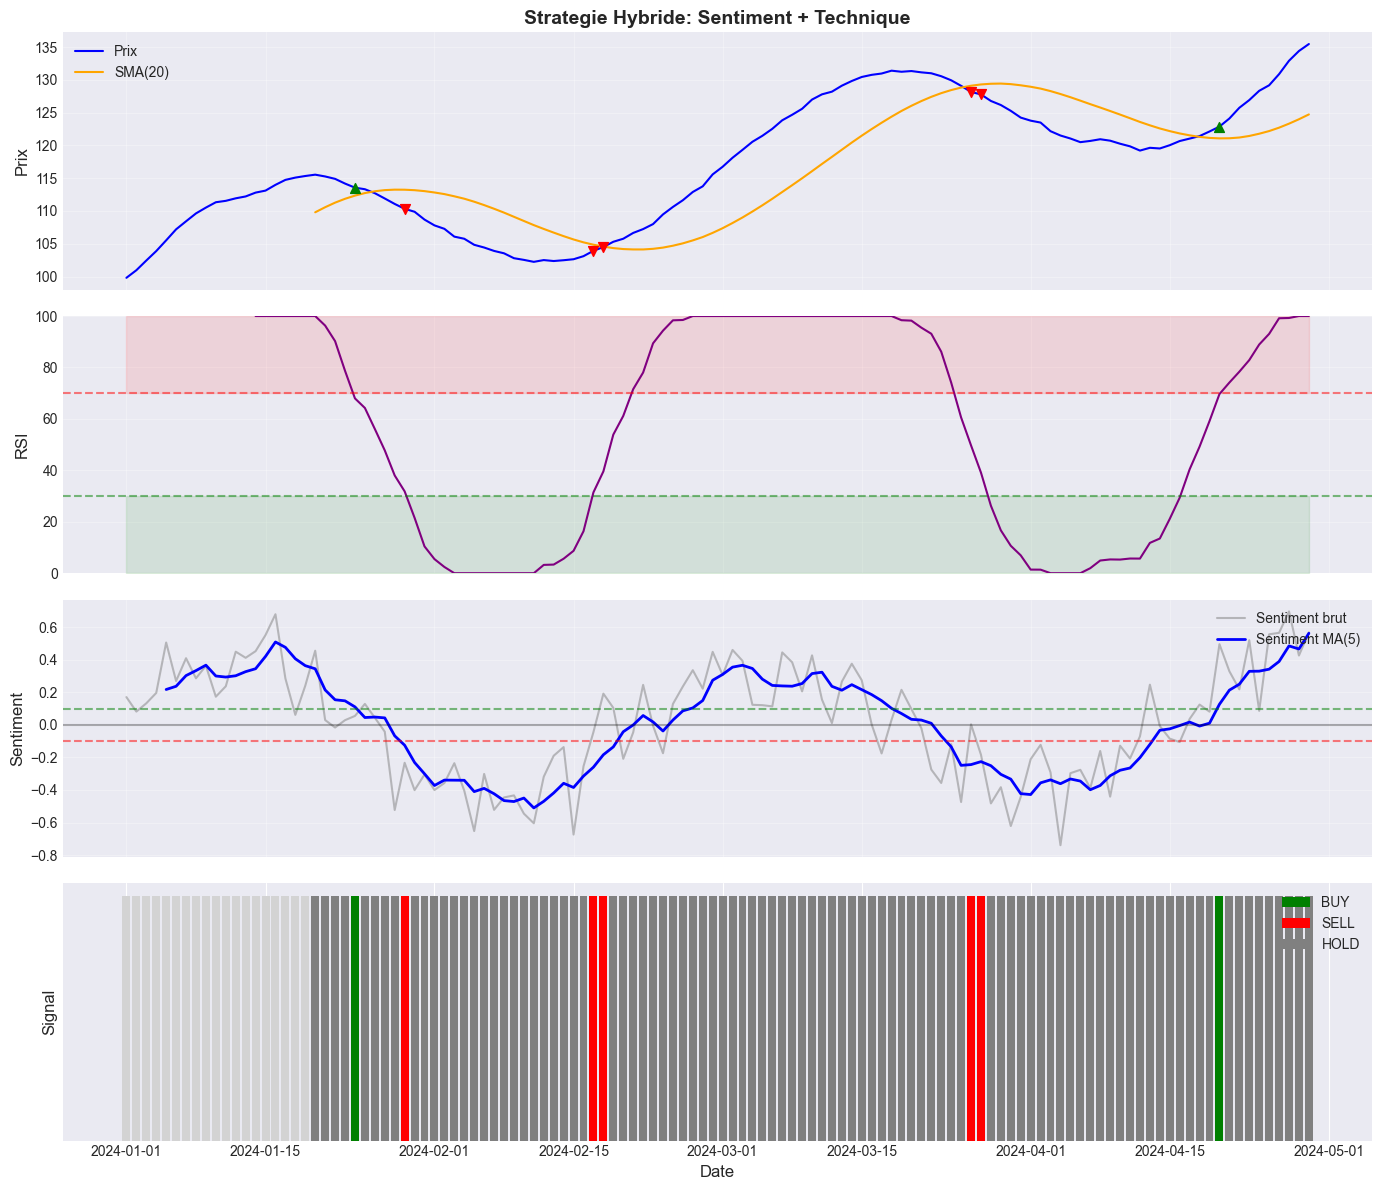
# Simulation locale de la strategie hybride

def calculate_sma(prices, period):
    """Calcule la SMA."""
    return pd.Series(prices).rolling(window=period).mean().values

def calculate_rsi(prices, period=14):
    """Calcule le RSI."""
    prices = pd.Series(prices)
    delta = prices.diff()
    gain = delta.where(delta > 0, 0).rolling(window=period).mean()
    loss = (-delta.where(delta < 0, 0)).rolling(window=period).mean()
    rs = gain / loss
    rsi = 100 - (100 / (1 + rs))
    return rsi.values

# Generer des donnees
np.random.seed(456)
n = 120
dates = pd.date_range('2024-01-01', periods=n, freq='D')

# Prix avec tendance et cycles
trend = np.linspace(100, 130, n)
cycle = 10 * np.sin(np.linspace(0, 4 * np.pi, n))
noise = np.cumsum(np.random.randn(n) * 0.3)
prices = trend + cycle + noise

# Sentiment correle au cycle (avec decalage et bruit)
sentiment = 0.4 * np.sin(np.linspace(0.5, 4.5 * np.pi, n)) + np.random.randn(n) * 0.15
sentiment = np.clip(sentiment, -1, 1)

# Calculer indicateurs
sma = calculate_sma(prices, 20)
rsi = calculate_rsi(prices, 14)

# Calculer sentiment moyen mobile
sentiment_ma = pd.Series(sentiment).rolling(window=5).mean().values

# Generer signaux hybrides
hybrid_signals = []
threshold = 0.1

for i in range(len(prices)):
    if np.isnan(sma[i]) or np.isnan(rsi[i]) or np.isnan(sentiment_ma[i]):
        hybrid_signals.append('WAIT')
        continue

    sent = sentiment_ma[i]
    price = prices[i]
    sma_val = sma[i]
    rsi_val = rsi[i]

    # Signal d'achat
    if sent > threshold and price > sma_val and rsi_val < 70:
        hybrid_signals.append('BUY')
    # Signal de vente
    elif sent < -threshold and price < sma_val and rsi_val > 30:
        hybrid_signals.append('SELL')
    else:
        hybrid_signals.append('HOLD')

# Visualisation
fig, axes = plt.subplots(4, 1, figsize=(14, 12), sharex=True)

# Prix et SMA
ax1 = axes[0]
ax1.plot(dates, prices, 'b-', label='Prix', linewidth=1.5)
ax1.plot(dates, sma, 'orange', label='SMA(20)', linewidth=1.5)
# Marquer les signaux
for i, sig in enumerate(hybrid_signals):
    if sig == 'BUY':
        ax1.scatter([dates[i]], [prices[i]], color='green', s=50, marker='^', zorder=5)
    elif sig == 'SELL':
        ax1.scatter([dates[i]], [prices[i]], color='red', s=50, marker='v', zorder=5)
ax1.set_ylabel('Prix', fontsize=12)
ax1.set_title('Strategie Hybride: Sentiment + Technique', fontsize=14, fontweight='bold')
ax1.legend(loc='upper left')
ax1.grid(True, alpha=0.3)

# RSI
ax2 = axes[1]
ax2.plot(dates, rsi, 'purple', linewidth=1.5)
ax2.axhline(y=70, color='red', linestyle='--', alpha=0.5)
ax2.axhline(y=30, color='green', linestyle='--', alpha=0.5)
ax2.fill_between(dates, 70, 100, alpha=0.1, color='red')
ax2.fill_between(dates, 0, 30, alpha=0.1, color='green')
ax2.set_ylabel('RSI', fontsize=12)
ax2.set_ylim(0, 100)
ax2.grid(True, alpha=0.3)

# Sentiment
ax3 = axes[2]
ax3.plot(dates, sentiment, 'gray', alpha=0.5, label='Sentiment brut')
ax3.plot(dates, sentiment_ma, 'blue', linewidth=2, label='Sentiment MA(5)')
ax3.axhline(y=0.1, color='green', linestyle='--', alpha=0.5)
ax3.axhline(y=-0.1, color='red', linestyle='--', alpha=0.5)
ax3.axhline(y=0, color='black', linestyle='-', alpha=0.3)
ax3.set_ylabel('Sentiment', fontsize=12)
ax3.legend(loc='upper right')
ax3.grid(True, alpha=0.3)

# Signaux
ax4 = axes[3]
colors_map = {'BUY': 'green', 'SELL': 'red', 'HOLD': 'gray', 'WAIT': 'lightgray'}
for i, (date, sig) in enumerate(zip(dates, hybrid_signals)):
    ax4.bar(date, 1, color=colors_map[sig], edgecolor='none')
ax4.set_ylabel('Signal', fontsize=12)
ax4.set_xlabel('Date', fontsize=12)
ax4.set_yticks([])
legend_elements = [Patch(facecolor=c, label=l) for l, c in colors_map.items() if l != 'WAIT']
ax4.legend(handles=legend_elements, loc='upper right')

plt.tight_layout()
plt.show()

# Statistiques
signal_counts = pd.Series(hybrid_signals).value_counts()
print("\nStatistiques des signaux hybrides:")
for sig, count in signal_counts.items():
    print(f"  {sig}: {count} ({count/len(hybrid_signals)*100:.1f}%)")

print("\nConditions pour signal BUY:")
print("  - Sentiment MA > 0.1")
print("  - Prix > SMA(20)")
print("  - RSI < 70")