def visualize_equilibrium_regions():
    """
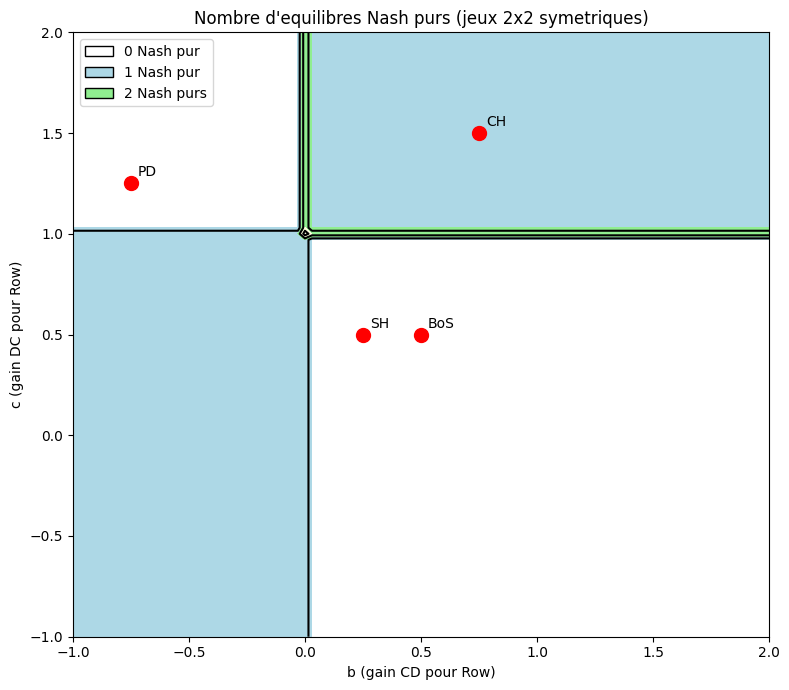
    Visualise les regions d'equilibres dans l'espace des parametres.

    Pour un jeu 2x2 symetrique avec gains (a,b,c,d) pour Row:
        (a, a)  (b, c)
        (c, b)  (d, d)

    On fixe a=1, d=0 et on varie b et c.
    """
    a, d = 1, 0
    b_range = np.linspace(-1, 2, 100)
    c_range = np.linspace(-1, 2, 100)
    B_grid, C_grid = np.meshgrid(b_range, c_range)

    n_pure_nash = np.zeros_like(B_grid)

    for i, b in enumerate(b_range):
        for j, c in enumerate(c_range):
            A_mat = np.array([[a, b], [c, d]])
            B_mat = np.array([[a, c], [b, d]])  # Symetrique
            game = Game2x2(A_mat, B_mat)
            pure_eq = find_pure_nash(game)
            n_pure_nash[j, i] = len(pure_eq)

    # Visualisation
    fig, ax = plt.subplots(figsize=(8, 7))

    im = ax.contourf(B_grid, C_grid, n_pure_nash, levels=[0, 1, 2, 3, 4],
                     colors=['white', 'lightblue', 'lightgreen', 'lightyellow'])
    ax.contour(B_grid, C_grid, n_pure_nash, levels=[0.5, 1.5, 2.5, 3.5], colors='black')

    # Marquer les jeux classiques
    # PD: a=3, b=0, c=5, d=1 -> normalise: a=1, b=-0.75, c=1.25, d=0
    classic_games = {
        'PD': (-0.75, 1.25),
        'SH': (0.25, 0.5),
        'BoS': (0.5, 0.5),
        'CH': (0.75, 1.5),
    }

    for name, (b, c) in classic_games.items():
        if b_range[0] <= b <= b_range[-1] and c_range[0] <= c <= c_range[-1]:
            ax.plot(b, c, 'ro', markersize=10)
            ax.annotate(name, (b, c), textcoords="offset points", xytext=(5,5))

    ax.set_xlabel('b (gain CD pour Row)')
    ax.set_ylabel('c (gain DC pour Row)')
    ax.set_title('Nombre d\'equilibres Nash purs (jeux 2x2 symetriques)')

    # Legende
    from matplotlib.patches import Patch
    legend_elements = [
        Patch(facecolor='white', edgecolor='black', label='0 Nash pur'),
        Patch(facecolor='lightblue', edgecolor='black', label='1 Nash pur'),
        Patch(facecolor='lightgreen', edgecolor='black', label='2 Nash purs'),
    ]
    ax.legend(handles=legend_elements, loc='upper left')

    plt.tight_layout()
    plt.show()

visualize_equilibrium_regions()