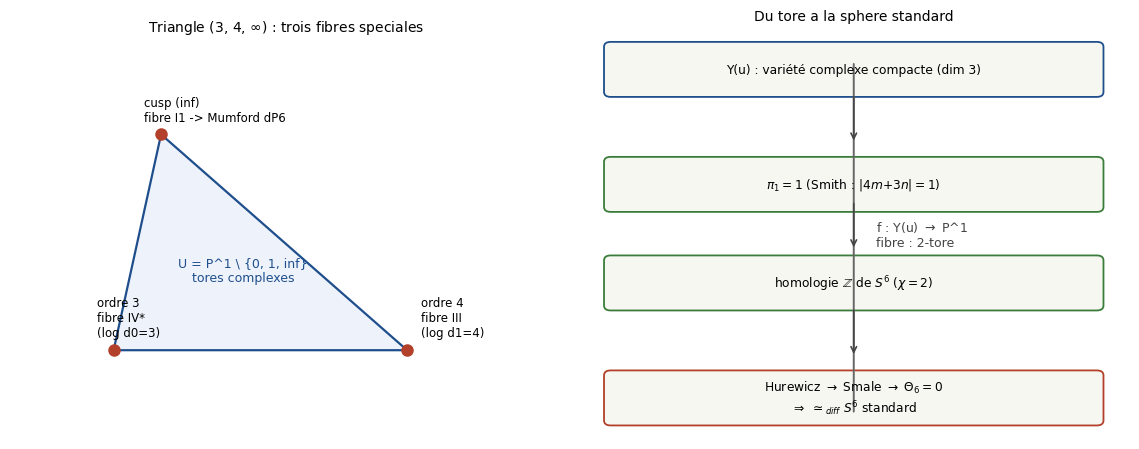
# Code 2.4 - Schema : le triangle (3,4,infini) et la fibration f : Y(u) -> P^1
%matplotlib inline
import matplotlib.pyplot as plt
import matplotlib.patches as mpatches
import numpy as np

fig, (ax1, ax2) = plt.subplots(1, 2, figsize=(11.5, 4.6))

# --- Panneau A : triangle hyperbolique (3, 4, inf) ---
tri = plt.Polygon([[0, 0], [3.4, 0], [0.55, 2.5]], closed=True,
                  facecolor="#eef3fb", edgecolor="#1f4e8c", lw=1.6)
ax1.add_patch(tri)
corners = {
    "ordre 3\nfibre IV*\n(log d0=3)": (0, 0),
    "ordre 4\nfibre III\n(log d1=4)": (3.4, 0),
    "cusp (inf)\nfibre I1 -> Mumford dP6": (0.55, 2.5),
}
for label, (x, y) in corners.items():
    ax1.plot(x, y, "o", ms=8, color="#b3402a")
    ax1.annotate(label, (x, y), textcoords="offset points",
                 xytext=(-12, 10) if x < 1 else (10, 10), fontsize=8.5)
ax1.annotate("U = P^1 \\ {0, 1, inf}\ntores complexes", (1.5, 0.8),
             fontsize=9, ha="center", color="#1f4e8c")
ax1.set_title("Triangle (3, 4, $\\infty$) : trois fibres speciales", fontsize=10)
ax1.set_xlim(-1.2, 5.2); ax1.set_ylim(-0.9, 3.6)
ax1.set_aspect("equal"); ax1.axis("off")

# --- Panneau B : la fibration et la reconnaissance ---
ax2.annotate("", xy=(0.5, 0.06), xytext=(0.5, 0.92),
             arrowprops=dict(arrowstyle="-", lw=1.4, color="#666"))
ax2.text(0.54, 0.5, "f : Y(u) $\\to$ P^1\nfibre : 2-tore", fontsize=9,
         va="center", color="#444")
for y, txt, col in [
    (0.9, "Y(u) : variété complexe compacte (dim 3)", "#1f4e8c"),
    (0.62, "$\\pi_1 = 1$ (Smith : $|4m{+}3n|{=}1$)", "#3a7d3a"),
    (0.38, "homologie $\\mathbb{Z}$ de $S^6$ ($\\chi=2$)", "#3a7d3a"),
    (0.10, "Hurewicz $\\to$ Smale $\\to$ $\\Theta_6{=}0$\n$\\Rightarrow$ $\\simeq_{diff}$ $S^6$ standard", "#b3402a"),
]:
    ax2.add_patch(mpatches.FancyBboxPatch(
        (0.06, y - 0.055), 0.88, 0.11,
        boxstyle="round,pad=0.012", fc="#f7f7f2", ec=col, lw=1.3))
    ax2.text(0.5, y, txt, fontsize=8.8, ha="center", va="center")
for y0, y1 in [(0.84, 0.72), (0.58, 0.46), (0.32, 0.20)]:
    ax2.annotate("", xy=(0.5, y1), xytext=(0.5, y0),
                 arrowprops=dict(arrowstyle="->", lw=1.2, color="#444"))
ax2.set_title("Du tore a la sphere standard", fontsize=10)
ax2.set_xlim(0, 1); ax2.set_ylim(0, 1); ax2.axis("off")
plt.tight_layout()
plt.show()