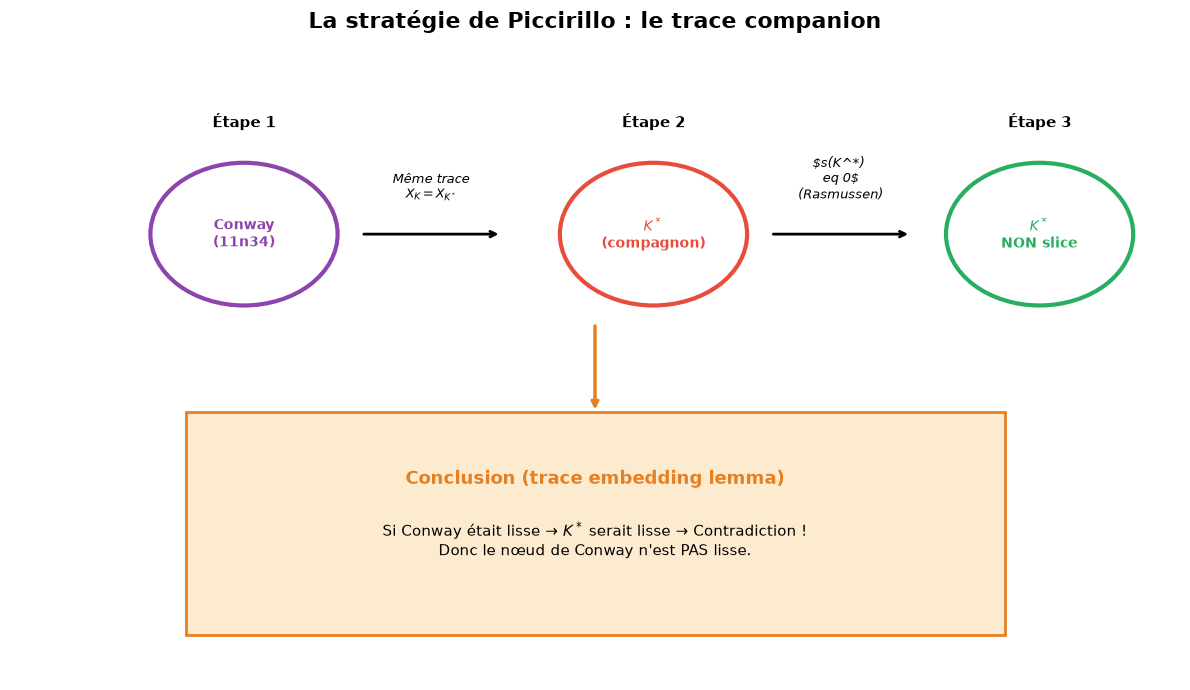
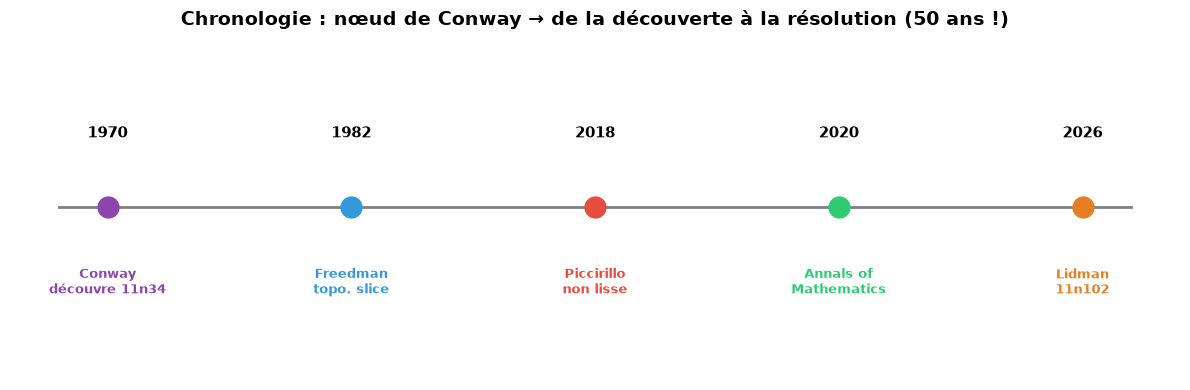
# Schematic of the trace companion strategy
fig, ax = plt.subplots(figsize=(12, 7))
ax.set_xlim(0, 10)
ax.set_ylim(0, 7)
ax.set_axis_off()

# Step 1: Conway knot
circle1 = plt.Circle((2, 5), 0.8, fill=False, color='#8e44ad', linewidth=3)
ax.add_patch(circle1)
ax.text(2, 5, 'Conway\n(11n34)', ha='center', va='center',
        fontsize=10, fontweight='bold', color='#8e44ad')
ax.text(2, 6.2, 'Étape 1', ha='center', fontsize=11, fontweight='bold')

# Arrow 1
ax.annotate('', xy=(4.2, 5), xytext=(3.0, 5),
            arrowprops=dict(arrowstyle='->', color='black', lw=2))
ax.text(3.6, 5.4, 'Même trace\n$X_K = X_{K^*}$', ha='center',
        fontsize=9, style='italic')

# Step 2: Companion knot
circle2 = plt.Circle((5.5, 5), 0.8, fill=False, color='#e74c3c', linewidth=3)
ax.add_patch(circle2)
ax.text(5.5, 5, '$K^*$\n(compagnon)', ha='center', va='center',
        fontsize=10, fontweight='bold', color='#e74c3c')
ax.text(5.5, 6.2, 'Étape 2', ha='center', fontsize=11, fontweight='bold')

# Arrow 2
ax.annotate('', xy=(7.7, 5), xytext=(6.5, 5),
            arrowprops=dict(arrowstyle='->', color='black', lw=2))
ax.text(7.1, 5.4, '$s(K^*) \neq 0$\n(Rasmussen)', ha='center',
        fontsize=9, style='italic')

# Step 3: Not slice
circle3 = plt.Circle((8.8, 5), 0.8, fill=False, color='#27ae60', linewidth=3)
ax.add_patch(circle3)
ax.text(8.8, 5, '$K^*$\nNON slice', ha='center', va='center',
        fontsize=10, fontweight='bold', color='#27ae60')
ax.text(8.8, 6.2, 'Étape 3', ha='center', fontsize=11, fontweight='bold')

# Conclusion box
rect = plt.Rectangle((1.5, 0.5), 7, 2.5, fill=True,
                      facecolor='#fdebd0', edgecolor='#e67e22', linewidth=2)
ax.add_patch(rect)
ax.text(5, 2.2, 'Conclusion (trace embedding lemma)',
        ha='center', fontsize=13, fontweight='bold', color='#e67e22')
ax.text(5, 1.4, 'Si Conway était lisse → $K^*$ serait lisse → Contradiction !\n'
        'Donc le nœud de Conway n\'est PAS lisse.',
        ha='center', fontsize=11)

# Arrow down
ax.annotate('', xy=(5, 3.0), xytext=(5, 4.0),
            arrowprops=dict(arrowstyle='->', color='#e67e22', lw=2.5))

ax.set_title('La stratégie de Piccirillo : le trace companion',
             fontsize=16, fontweight='bold', pad=20)
plt.tight_layout()
plt.savefig('piccirillo_strategy.png', dpi=150, bbox_inches='tight')
plt.show()