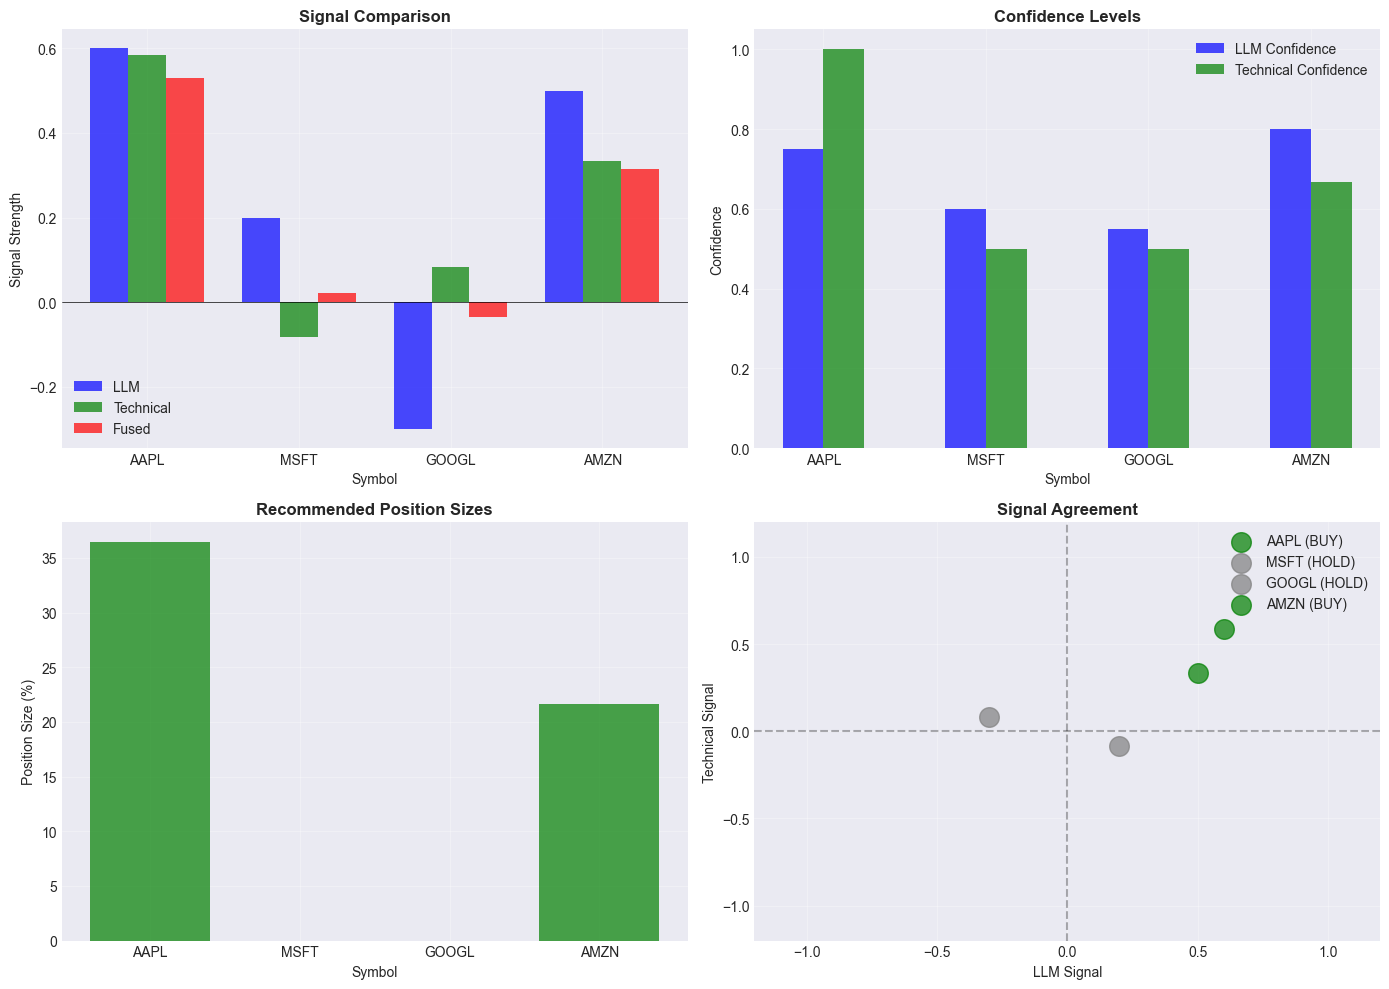
# Visualisation du systeme hybride

def visualize_hybrid_signals(signals: List[HybridSignal]):
    """
    Visualise les signaux hybrides.
    """
    if not signals:
        print("Pas de signaux a visualiser")
        return

    fig, axes = plt.subplots(2, 2, figsize=(14, 10))

    # Signal comparison
    ax1 = axes[0, 0]
    symbols = [s.symbol for s in signals]
    llm_signals = [s.llm_signal for s in signals]
    tech_signals = [s.technical_signal for s in signals]
    fused_signals = [s.fused_signal for s in signals]

    x = np.arange(len(symbols))
    width = 0.25

    ax1.bar(x - width, llm_signals, width, label='LLM', color='blue', alpha=0.7)
    ax1.bar(x, tech_signals, width, label='Technical', color='green', alpha=0.7)
    ax1.bar(x + width, fused_signals, width, label='Fused', color='red', alpha=0.7)

    ax1.set_xlabel('Symbol')
    ax1.set_ylabel('Signal Strength')
    ax1.set_title('Signal Comparison', fontsize=12, fontweight='bold')
    ax1.set_xticks(x)
    ax1.set_xticklabels(symbols)
    ax1.axhline(y=0, color='black', linestyle='-', linewidth=0.5)
    ax1.legend()
    ax1.grid(True, alpha=0.3)

    # Confidence levels
    ax2 = axes[0, 1]
    llm_conf = [s.llm_confidence for s in signals]
    tech_conf = [s.technical_confidence for s in signals]

    ax2.bar(x - width/2, llm_conf, width, label='LLM Confidence', color='blue', alpha=0.7)
    ax2.bar(x + width/2, tech_conf, width, label='Technical Confidence', color='green', alpha=0.7)

    ax2.set_xlabel('Symbol')
    ax2.set_ylabel('Confidence')
    ax2.set_title('Confidence Levels', fontsize=12, fontweight='bold')
    ax2.set_xticks(x)
    ax2.set_xticklabels(symbols)
    ax2.legend()
    ax2.grid(True, alpha=0.3)

    # Position sizes
    ax3 = axes[1, 0]
    positions = [s.position_size * 100 for s in signals]
    colors = ['green' if s.final_direction == 'BUY' else 'red' if s.final_direction == 'SELL' else 'gray'
              for s in signals]

    ax3.bar(symbols, positions, color=colors, alpha=0.7)
    ax3.set_xlabel('Symbol')
    ax3.set_ylabel('Position Size (%)')
    ax3.set_title('Recommended Position Sizes', fontsize=12, fontweight='bold')
    ax3.grid(True, alpha=0.3)

    # Signal scatter
    ax4 = axes[1, 1]
    for s in signals:
        color = 'green' if s.final_direction == 'BUY' else 'red' if s.final_direction == 'SELL' else 'gray'
        ax4.scatter(s.llm_signal, s.technical_signal, s=200, c=color, alpha=0.7,
                   label=f"{s.symbol} ({s.final_direction})")

    ax4.axhline(y=0, color='black', linestyle='--', alpha=0.3)
    ax4.axvline(x=0, color='black', linestyle='--', alpha=0.3)
    ax4.set_xlabel('LLM Signal')
    ax4.set_ylabel('Technical Signal')
    ax4.set_title('Signal Agreement', fontsize=12, fontweight='bold')
    ax4.set_xlim(-1.2, 1.2)
    ax4.set_ylim(-1.2, 1.2)
    ax4.legend()
    ax4.grid(True, alpha=0.3)

    plt.tight_layout()
    plt.show()


# Generer quelques signaux de demonstration
demo_symbols = ['AAPL', 'MSFT', 'GOOGL', 'AMZN']
demo_signals = []

# Donnees simulees
demo_data = {
    'AAPL': {'price': 185, 'sma_20': 182, 'sma_50': 178, 'rsi_14': 62, 'macd': {'histogram': 0.3}, 'volume_ratio': 1.2},
    'MSFT': {'price': 380, 'sma_20': 385, 'sma_50': 375, 'rsi_14': 55, 'macd': {'histogram': -0.2}, 'volume_ratio': 0.9},
    'GOOGL': {'price': 140, 'sma_20': 138, 'sma_50': 142, 'rsi_14': 48, 'macd': {'histogram': 0.1}, 'volume_ratio': 1.0},
    'AMZN': {'price': 175, 'sma_20': 172, 'sma_50': 168, 'rsi_14': 72, 'macd': {'histogram': 0.5}, 'volume_ratio': 1.4},
}

demo_llm = {
    'AAPL': (0.6, 0.75),
    'MSFT': (0.2, 0.6),
    'GOOGL': (-0.3, 0.55),
    'AMZN': (0.5, 0.8),
}

for symbol in demo_symbols:
    llm_sig, llm_conf = demo_llm[symbol]
    signal = hybrid_system.generate_signal(
        symbol=symbol,
        llm_signal=llm_sig,
        llm_confidence=llm_conf,
        technical_data=demo_data[symbol]
    )
    demo_signals.append(signal)

visualize_hybrid_signals(demo_signals)